Last year, start up company Sight Machine entered the industrial space with the announcement of its manufacturing analytics platform. Built on an open source model, the technology uses artificial intelligence and machine learning algorithms and is designed to take in structured and unstructured data to develop data models. The system addresses the core challenge of a company’s need to cut through the complexity of analyzing the information coming from the plant floor, especially as the Industrial Internet of Things (IIoT) generates new forms of data.
Last month, the company introduced Sight Machine 2.0, expanding its analytics platform by adding Global Ops View for real time visibility across the enterprise. It includes contextualized dashboards that can be tailored for the needs of a user or function, and a tool that uses machine learning to determine the reasons for downtime.
“We’ve been developing our technology for more than five years now and we realized in the last year that the term ‘digital twin’ is increasingly being used to describe what we do,” said Jon Sobel, CEO and co-founder of Sight Machine. “The term has been used mostly to describe challenging problems involving modeling a complex asset like a jet engine. What we’ve built is a digital twin of the factory as a system. It is the same concept of modeling something physical. But, in our case, we are modeling the entire plant.”
The value of Sight Machine is its ability to combine, reuse, and make sense of the data manufacturers collect. For example, typically data scientists, developers and operators will attack a single problem—like machine downtime—from different perspectives, and then stitch everything together. The idea of having a digital twin of the plant floor means that the same models can be used over and over, filling the data gap by building off the same model.
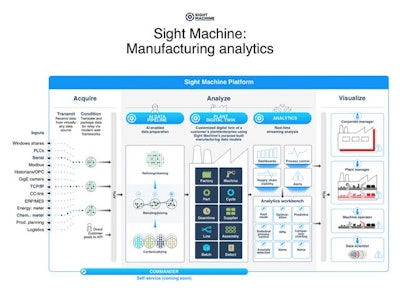
To be clear, Sight Machine is not a data lake where Big Data is dumped, rather, it is configured to mirror manufacturing production and automatically combine process and product data from every plant and supplier. Using plug-in representational state transfer (REST) application program interfaces (APIs), it receives data from virtually any source (historian, PLC, MES, ERP, batch reports, energy meters, etc.) and pulls it through its artificial intelligence to convert and contextualize the data, thereby generating the plant digital twin. From there, machine learning and advanced analytics can identify anomalies and generate insights.
In one example, a large manufacturing company with multiple plants around the world asked Sight Machine to decipher a decade worth of process data that was too varied to make sense of. Using the digital twin model, in less than a month the company was able to identify meaningful scrap savings and reduce the scrap rate by 30 percent. It also pinpointed process improvements in sophisticated electronics production that they could never see before.
The significance here is that unlike the digital twin model in PLM that is set up to understand what a parameter change would look like, the Sight Machine digital twin uses an underlying set of models to process data as things happen, and it alerts people of what is going on in order to build projections and forecasts.
Moreover, it is all the same data working at different levels of granularity and viewable by different business people. That’s where the new Global Ops View comes in.
Using Global Ops View, on one screen, executives can track output worldwide or by country, plant, machine, machine type or contract manufacturer—all of which is updated in real time from Sight Machine.
Contextualized dashboards let different user types see exactly the information their roles demand, and can be adapted to changing business needs. A corporate manager’s dashboard can provide standardized KPIs to compare across divisions, plants, and suppliers, helping identify problems and best practices. A plant manager’s dashboard can offer real-time visibility into every machine and line on the factory floor for immediate and actionable insights on productivity. A machine operator’s dashboard can provide key sensor data for monitoring, optimization and troubleshooting.
And a feature called Downtime Classifier helps technicians quickly identify the cause of unplanned downtime through an automated analysis of the data generated when machines or lines shut down. During initial setup it captures machine and manual input to calibrate a model for downtime classification, and then continuously improves its capabilities through machine learning.
Another function, Sight Machine Commander, available in the first half of 2017, will give manufacturers and integrators the ability to add new data sources and data types through an intuitive-web based interface. This is a step away from traditional analytics and reporting systems that are constrained by limited data sources and the need for IT experts to get involved, and a step toward self-service data preparation and analytics that allow non-specialist users to bring in new data types to design and do the analysis themselves.
“It is a great moment and a big move to say to customers that we have models that you’ve never had before, and you will have the ability to work with the models yourself,” Sobel said. “That’s important, because a lot of companies think strategically about data and they don’t want to buy a solution that gives them benefit today but has no flexibility and scale. One day, the company will combine design, engineering, production and product data in the field. They don’t know how they will do this yet, which is okay, but it is important to choose tools that are open so that the data moves freely back and forth, and experts inside the company have the ability to use the tools the way that they want.”