As management guru Peter Drucker wrote, “If you can’t measure it, you can’t improve it.” This adage has never been truer as food and beverage companies emphasize plant utilization after years of consolidation. However, more sensors and advanced industrial networking are also producing challenges in analyzing mountains of plant data.
With the digital transformation underway, key performance indicators (KPIs) are evolving and expanding across the enterprise.
“Multiple systems make it difficult to accurately compare performance via KPI metrics from plant to plant,” says Keith Chambers, director of operations, execution software and industry business at Schneider Electric. “This comparison is exactly what is necessary to implement long-term manufacturing IT cost-reduction and digitization strategies.”
The decades-old metric of overall equipment effectiveness (OEE) — availability x performance x quality — is a good fit for high-speed production lines in food and beverage plants, especially for companies with multiple production plants.
“Implementing a system to manage OEE is a minimum requirement to begin a digital transformation across a multisite manufacturing enterprise,” says Chambers. “Companies that are rolling out OEE as a multiplant initiative can utilize this approach as a platform for future digital operations management, process improvement and support programs.”
Recently, Saudi Arabia-based Almarai announced that it would add Schneider Electric’s Line Performance Suite, workflow and quality-management components to its existing manufacturing execution system (MES) to create a richer dataset for 100 filling and packaging lines.
“The line performance component helps to accelerate deployment by standardizing operational processes, and our next step is to gain better visibility to this data to empower our team to make smarter, more informed decisions,” says Sjur Fitje, general manager of manufacturing at Almarai.
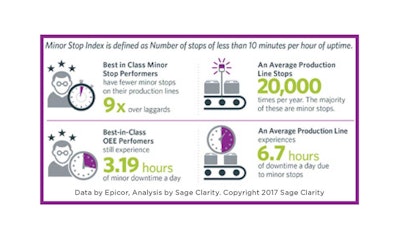
As companies scale up operational approaches, improved metrics and richer data-sets are coming along for the ride. A recent 2017 OEE Benchmark study via Epicor and Sage Clarity provides an insightful glimpse into more than 20 KPIs based on real-time, manufacturing production data over a three-month time frame.
This unique study and correlations rely on real-time operational data from multiple industries, including food and beverage. Epicor’s Informance Enterprise Manufacturing Intelligence Suite gathered the production data, while Sage Clarity provided analysis that showed correlations to operational success.
The study uses OEE as the top indicator of performance and ranks each manufacturer by that metric, but also uses other KPIs, such as minor stops and the SKU anomaly metric under the production analysis category.
“Minor stops are a chronic problem in the food and beverage industry, up to 60 percent of downtime,” says John Oskin, CEO of Sage Clarity Solutions. Minor stops are difficult to capture manually and require automatic data collection. Otherwise, companies are ignoring 60 percent of production problems.
Another interesting takeaway from the study is that the asset utilization index for food and beverage plants is at approximately 58 percent.