U.S. Geological Survey research has revealed contaminants, including per- and polyfluoroalkyl substances (PFAS) found in food process wastewater, possibly raising environmental concerns.
 Hubbard at the “PFAS: Impact on the Planet and Solutions for the Packaging Industry” event in Madison, WI.
Hubbard’s research, published in 2022, showed that the tested food process wastewater (FPWW) “did contain a plethora of both chemical and microbial contaminants, and they had a very different profile than other known sources such as municipal wastewater,” she says. “It’s really an underappreciated source of contaminants to U.S. streams.”
Food Process Wastewater Reconnaissance
The research was made up of three phases, with the initial phase being a reconnaissance study to examine a wide range of organic chemicals in effluent discharged from 23 facilities across 17 states.
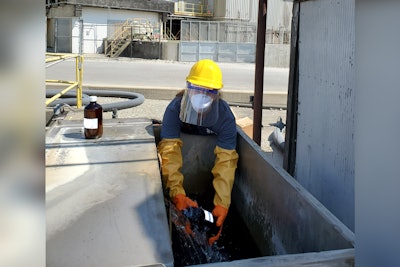
 Hubbard's team studied FPWW from facilities across the U.S.Hubbard et al., 2022; ES&T
Hubbard’s team searched for 576 different organic chemicals, including pesticides, antibiotics, hormones, pharmaceuticals, PFAS, and volatile organic compounds. They also searched for bacterial growth, antibiotic-resistant bacteria, and antibiotic-resistance genes, as well as inorganics like nutrients, cations, and anions.
“In all, we had 186 organics detected, so about 32% of what we looked for,” says Hubbard. “We had up to 48 [organic chemicals] detected in one sample.”
That largest detection of a single chemical was 6:2 fluorotelomer sulfonate (6:2 FTS), a form of PFAS, at 143,000 nanograms per liter.
The most striking find was the high concentration of total PFAS detected at a soy oil processing facility, at 185,000 nanograms per liter; three orders of magnitude than most municipal wastewater, and “in the range of some PFAS manufacturing facility water discharge,” Hubbard says.
The PFAS observed in food process wastewater is potentially derived from a combination of PFAS in the plant or animal materials being processed or industrial uses in the facilities themselves such as PFAS in deluge systems and FDA approved uses such as O-rings and gaskets, Hubbard explains.
Examining Environmental Impacts
The study’s second phase focused on environmental exposures downstream from select facilities. Hubbard’s team chose seven facilities across six states from phase one, based on previous results and the accessibility of receiving streams for testing.
The soy oil facility continued to show significant PFAS results downstream, prompting a more in-depth investigation of that facility through a PFAS food web study in the third phase.
The team collected water, effluent, bed sediment, and whole organisms, including benthic invertebrates, fish species, riparian spiders, and macrophytes from the area.
The water and bed sediment results showed a clear effect of effluent discharge downstream of the facility outfall, “in both the concentration and number of PFAS,” Hubbard explains. “In upstream water it was about two and a half nanograms per liter, versus the downstream water of about 36 nanograms per liter.”
The most prominent PFAS detected was again 6:2 FTS, which Hubbard explains is “not 100% bio-treated, which is why we are likely seeing it in the receiving stream.”
The results were a bit more nuanced when it came to tissue samples of downstream organisms.
The number of PFAS detections in downstream tissue samples ranged from zero to 23 additional PFAS, and total PFAS concentration of these substances increased between 37 and 182%.
The varying PFAS levels among samples suggest that feeding preferences may be causing the variations in PFAS uptake in sampled organisms.
The black stripe minnow, for example, showed the highest number of PFAS detected and total PFAS concentration increase between upstream and downstream samples of any organism.
“They have this habit of skimming along just beneath the surface of the water, perhaps coming into contact with more foams and the surface micro-layer which we know can have larger concentrations of PFAS,” Hubbard says.
Damsel flies and riparian spiders also had similar PFAS profiles, Hubbard explains, “perhaps suggesting that the riparian spiders are feeding on these damsel flies as they’re emerging [from the stream].”
Hubbard’s research highlights the importance of continuous monitoring and the need for more comprehensive studies to fully understand the scale and impact of contaminants like PFAS coming from food processing facilities.